
Market Insight Aug 2025
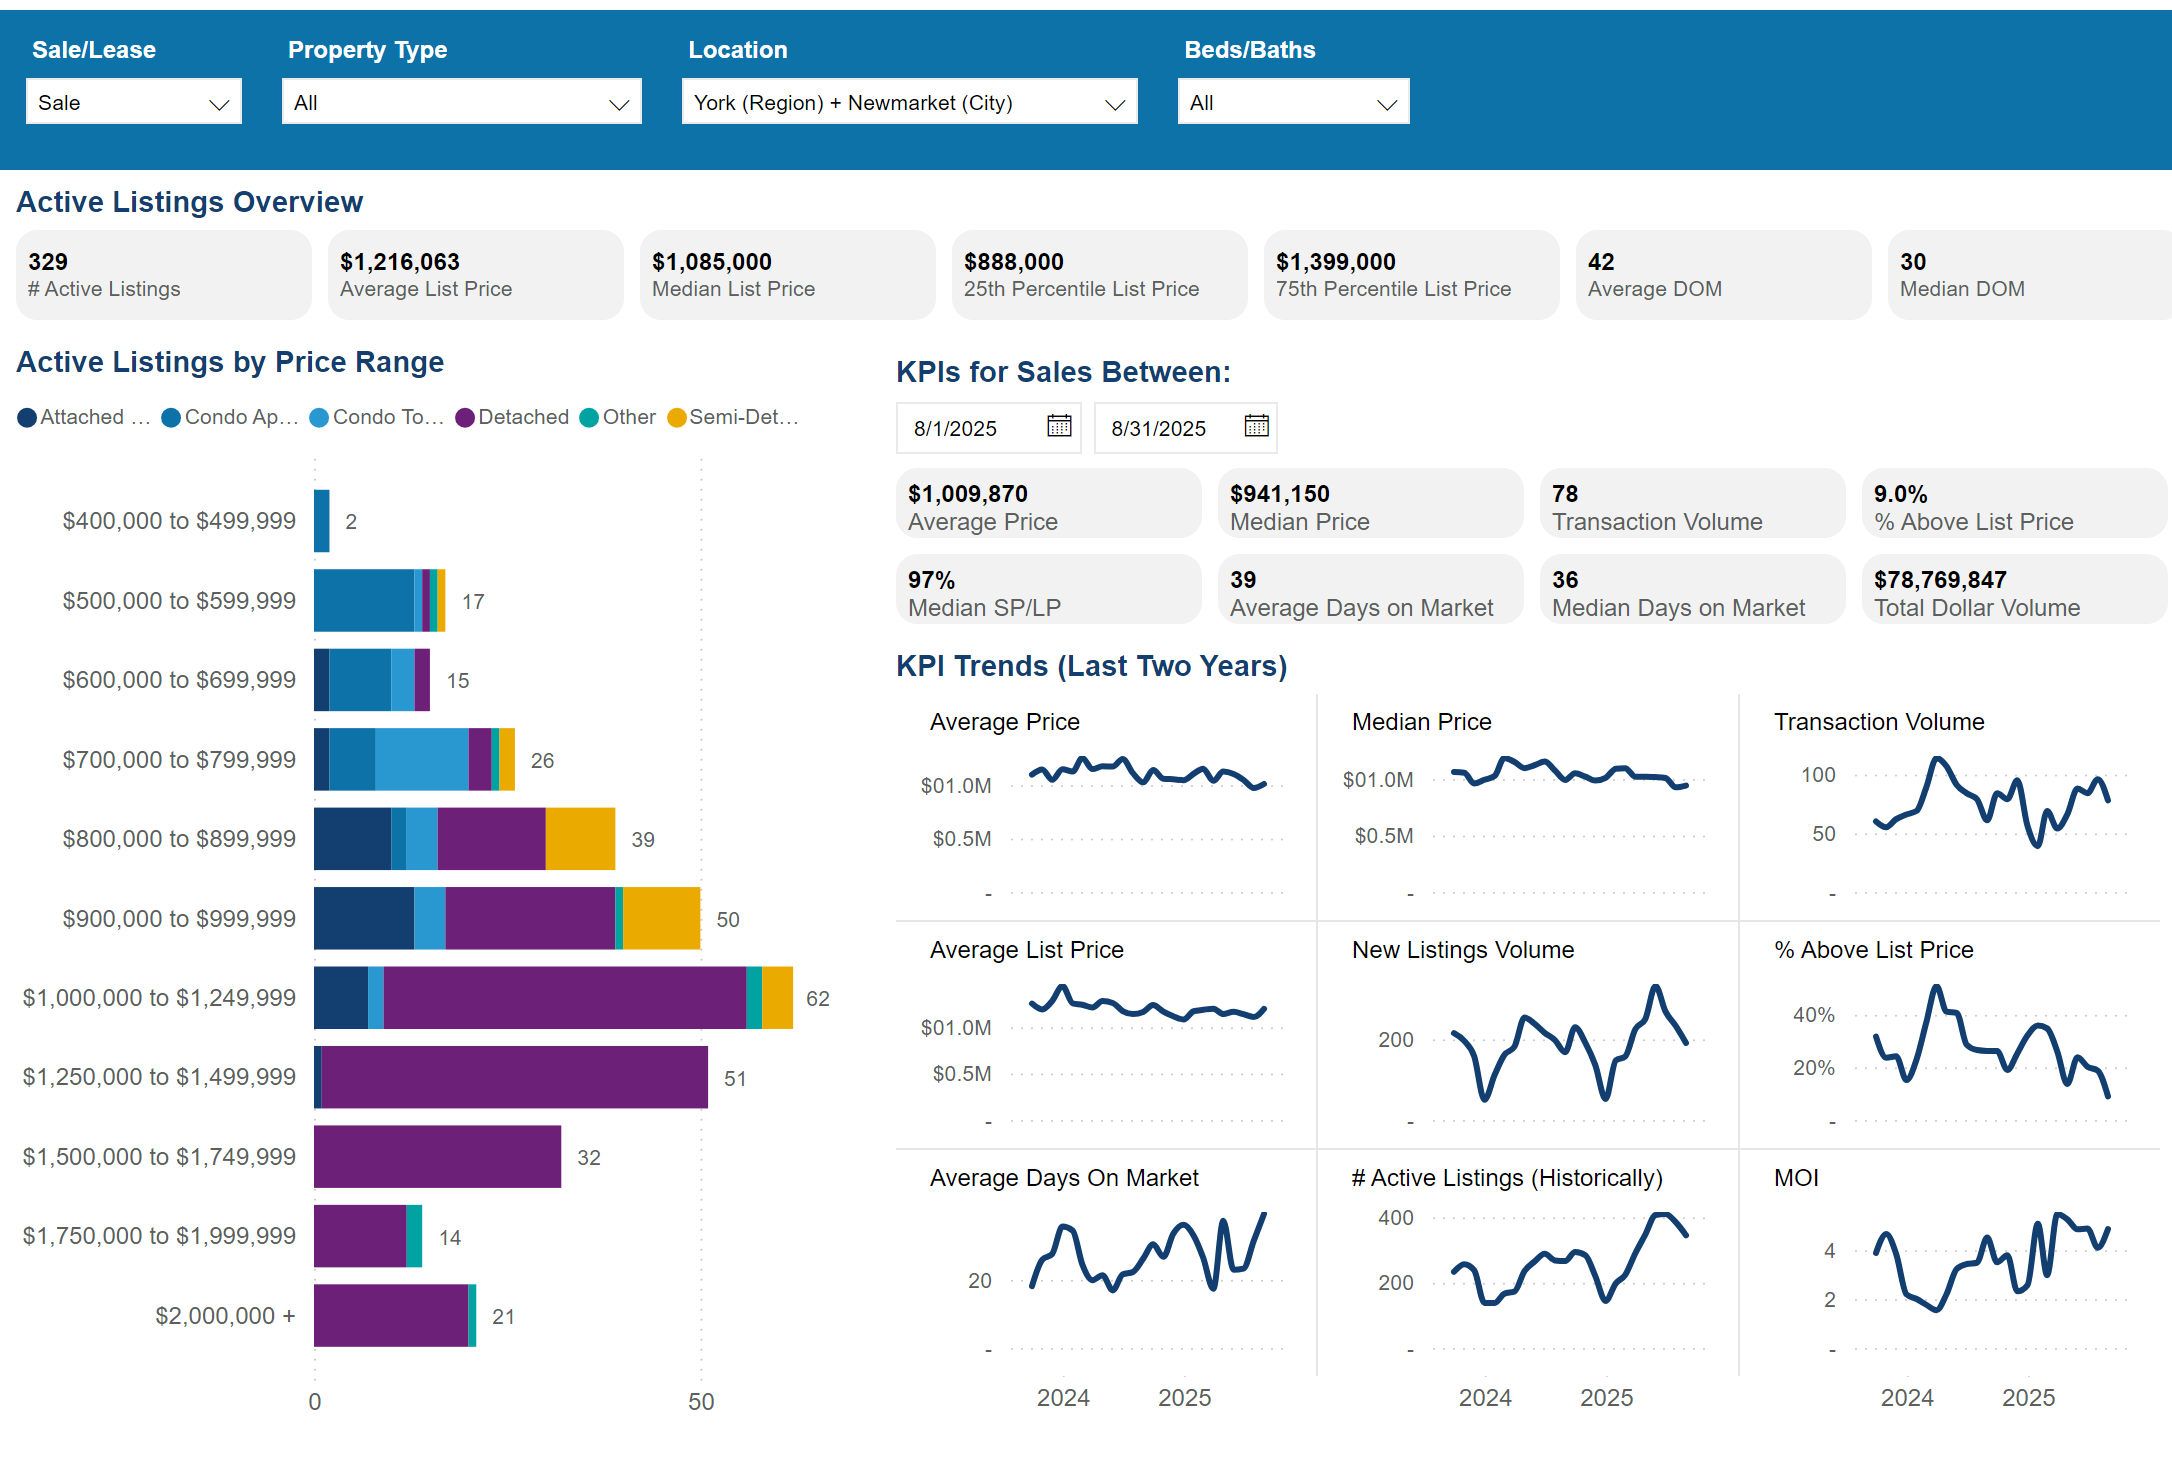
With 78 home units were sold in Aug the average home price in Newmarket city reached 1million/unit, a number easy to remember. Out of the 78 units 57.5% were sold with price under 1million/unit.
At the end of Aug there were 329 units active on market, more than half 54% were listed under $1million/unit. The average listing price is $1.2million/unit, 20% higher than sold average.
Last 2 years activities showed price sideway, sales volume may dwindle a little bit but still very stable, new listings increase gradually, inventory increase to highest level, so to sell a home at market it may take longer time.
How Does Active Listing Go?
Understand Home Inventory Movement
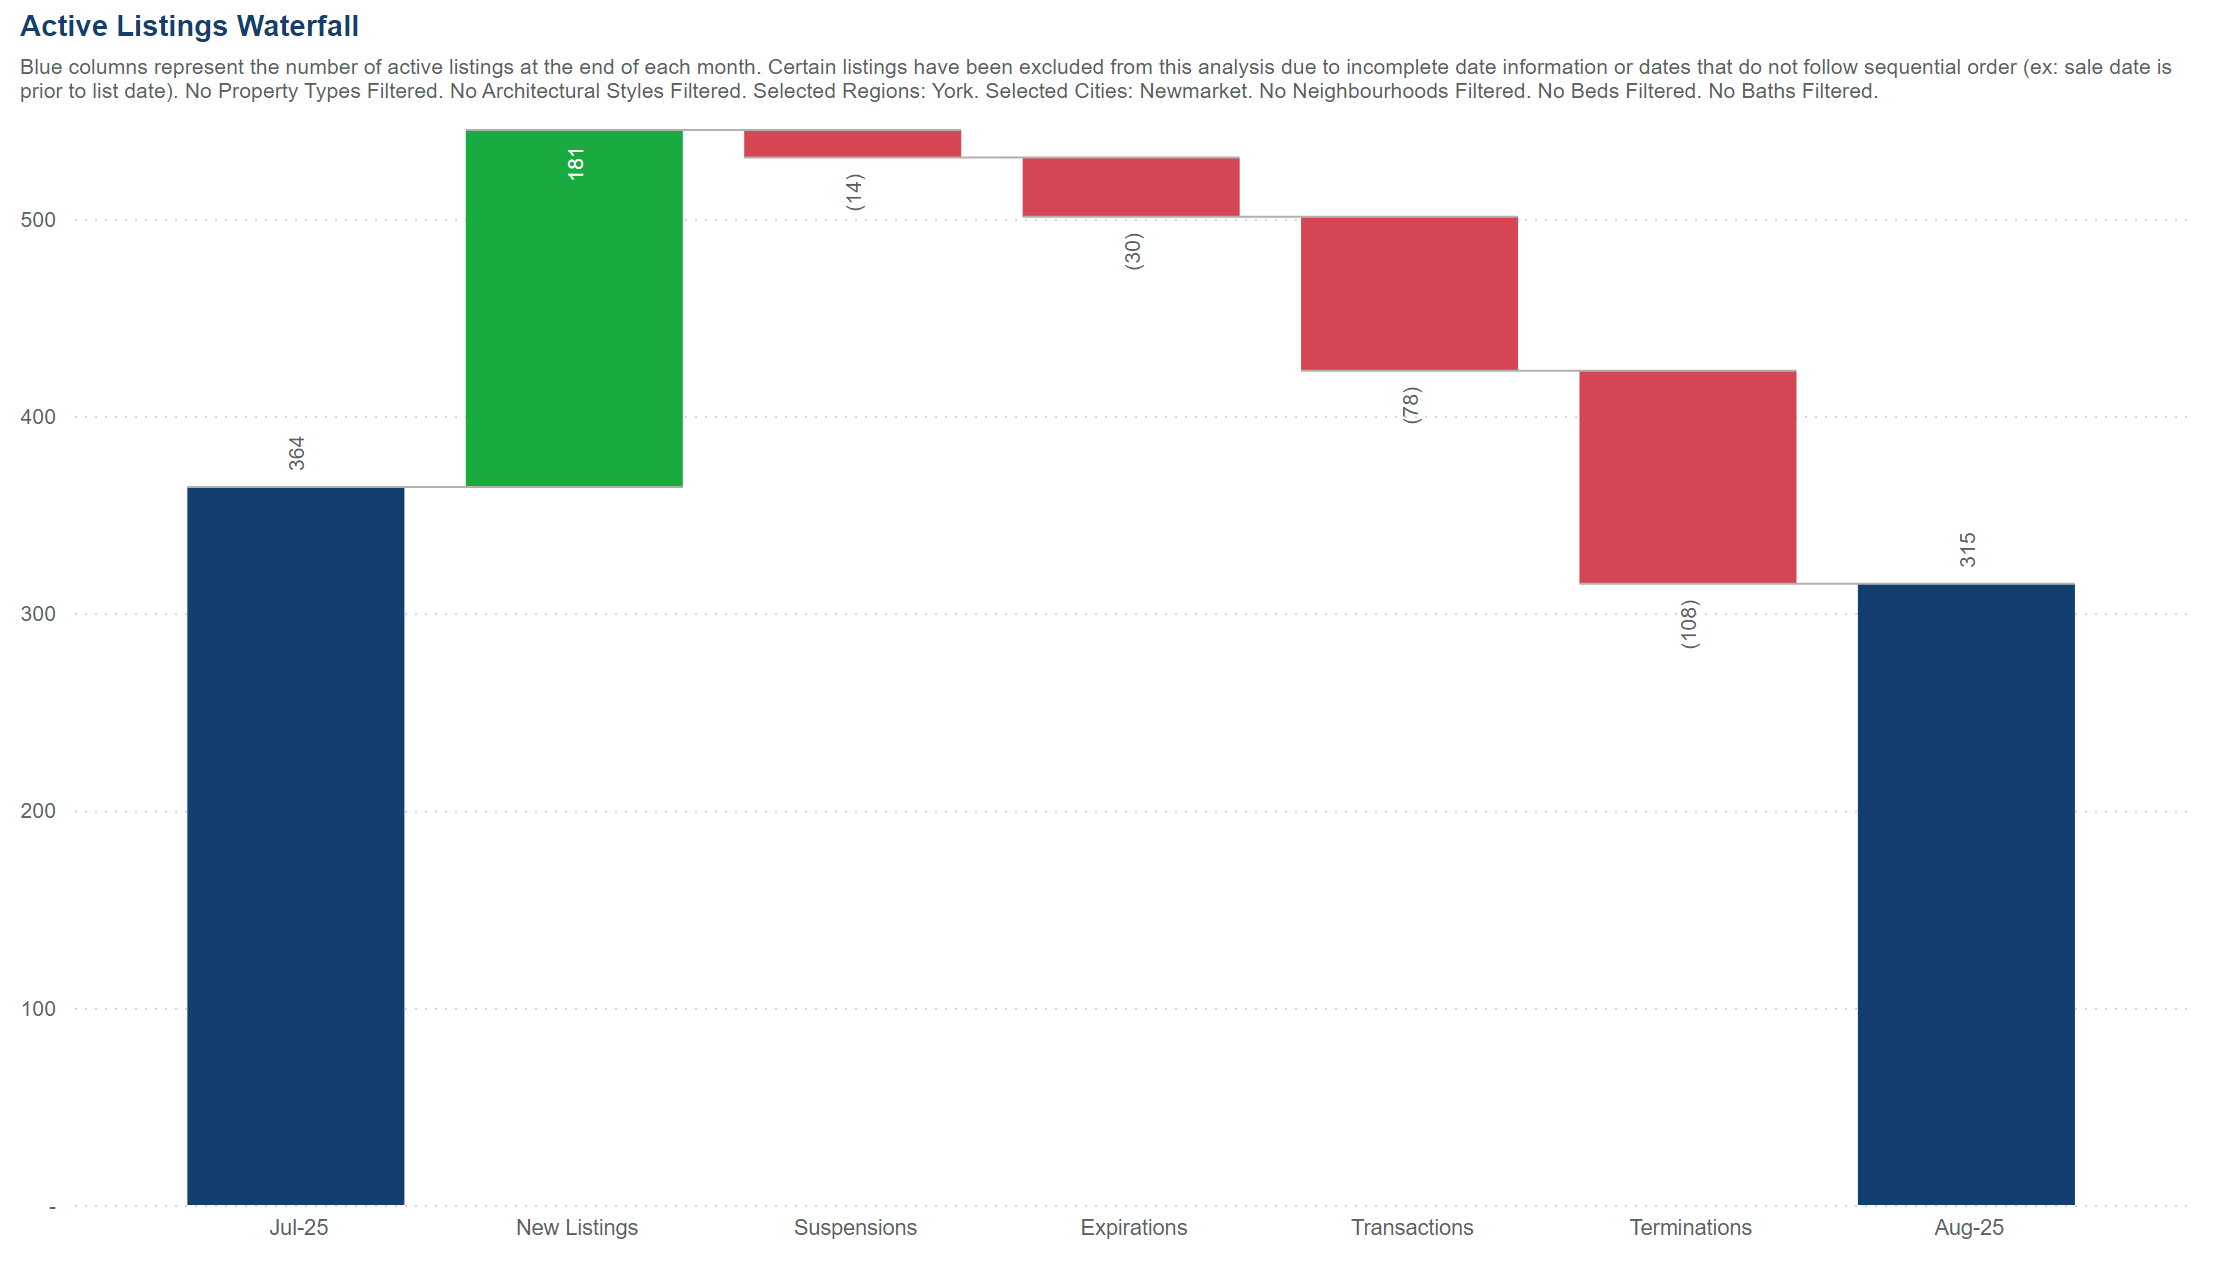
At end of last month July there were 364 active listings, at end of Aug the active listing decreased to 315. Does the difference of 49 units means sold units? from the active waterfall graph below we can see 5 types of activities explain such difference:
First, 181 New Listings add to market in the month,
Second, 78 units were sold out in the month,
While there were other 3 activities affecting the active listings on the market, there are categorized as Suspensions, Expirations and Terminations. In Toronto, a Suspended MLS® listing is a temporary pause where showings are halted but the agreement remains in effect, while a Terminated listing is the cancellation of the MLS® listing agreement, either by mutual consent (Form 242) or because the seller wants to change realtors or no longer wishes to sell. An Expired listing is one that has reached the end of its agreed-upon contract term and automatically ends, requiring proper termination to take it off the market.
in Aug 2025, 108 units were terminated, 30 units Expired, 14 suspended. if it's difficult for you to understand, just imagine you are a Seller, you signed a listing agreement with a real estate agent for 3 months. After the house is on market for 20 days you realize the market price gets lower and the current listing price doesn't help you to sell faster, at this point you can decide to terminate the agreement and sign a new one.
Newmarket Recent 30 Year Home Price Data
Long Term Trend (1996 - 2025)
Over the 30 years from1996 to 2025, Newmarket average home price increased 4.4 times from $196k in 1996 to $1 million in 2025, annualized growth of 14.7%.
Let's see the dynamic of Newmarket Home Real Estate Market by dividing 30 years into 6 each 5-years phases:
1996-2000, home prices rise moderately, with an annualized price increase of 4%
2001-2005, home prices continued to rise faster, with an annualized price increase of 7%
2006-2011, home prices were experiencing the 2008 financial crisis and moved sideways; but overall still with an annualized price increase of 5.5%
2012- 2016, housing prices rose aggressively, with an annualized price increase of 17%;
2017 to 2021, the housing prices fluctuated violently, with an annualized price increase of 6.7%
2022 - 2026 Forecast, We know the most significant home price hike occurred after 2020 covid break out and peaked in Feb 2022, Newmarket Home Average Price peaked at 1.4million / unit for that month. Starting from 2023 the annual price increase turned into negative up to Now Aug 2025.