
Price to Income Ratio with New Household Income Data in Canada
I still remember 2 years ago when I got the letter from the mail box asking all people to join 2016 Census. Based on today’s Census result 35million of people have been involved and counted. When the report is released I guess everyone has accumulated great curiosity. I read through the report with excitement as lots of my questions have been answered, and I do think the report bring great value for real estate investors in helping us measure the existing market and even bravely make our own projection.
Here are summaries of the report issued by Statistic Canada on Sep 13th, but take that note before digesting the bulletin points below, this census release paints a picture of the income of Canadians in 2015 before the effects of the oil price slow down in 2015 and 2016 were fully felt.
• An important factor in the economic story of Canada over the decade was high resource prices that drew investment and people to Alberta, Saskatchewan and Newfoundland and Labrador, boosted the construction sector, and more generally filtered through the economy as a whole.
• This boom in the resource sector coincided with a decline in the manufacturing sector, with fewer jobs in this sector in 2015 than 2005. The bulk of these manufacturing job losses were in Ontario and Quebec.
• Led by growth in resource-rich provinces, median income rose 10.8% in Canada from 2005 to 2015, compared with 9.2% growth in the previous decade and a decline of 1.8% the decade before that.
• This growth was not distributed evenly across Canada. Resource-based provinces and regions had the highest income growth, led by Nunavut, and Saskatchewan. Median income growth was slowest in Ontario and Quebec, the two provinces with the largest populations and significant manufacturing activity.
• The low-income rate was relatively stable over the last decade, rising marginally from 14.0% in 2005 to 14.2% in 2015. There were regional variations over the decade. The number of persons in low income declined in Saskatchewan and Newfoundland and Labrador, while the number increased in Ontario. There were also variations.
Some significant events occurred after the oil price slow down which started at the end of 2014:
• Trudeau Liberals won a majority in the 2015 Federal Election,
• Oil price went down to the lowest point of 27.94 /barrel on Feb 9th, 2016,
• Bank of Canada decreased prime interest rate twice within the year of 2015: to 0.75% in Jan 2015 and further decreased to 0.5% July 2015, which echoed the recent interest rate hiking in 2 years: To 0.75% in July 2017 and further increased to Sep 2017
• In 2017 the real consumer spending and residential investment growth, The two sectors combined now account for a record 66% share of Canada’s GDP.
• Canada’s GDP has grown at an annualized average of 2.5 per cent and 290,000 jobs have been created in 2017. 2017 an economic win for Canada, no matter what happens in the second half.
According to Toronto household income 78,373/household and average price 732,292, the Price to Income ratio is 9.34; While in 2005 the average house price is 304900, and the Price to Income ratio is 4.03 in 2005. and my explanation to that increase is: People prefer to spend more by living in Toronto, which is echoed by the high ranking of Toronto as the most livable city.
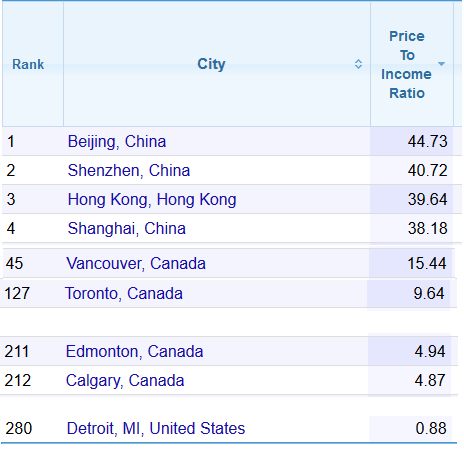 Please see the table on right, This ranking of Rice to Income Ratio comes from https://www.numbeo.com/, which gave a complete picture for global comparison. If some people complain about the high house price and argue they want to live in the city with the lowest Price to Income ratio, they definitely can choose Detroit MI United States with lowest ratio 0.88 ranking 280. and the total number of cities listed here for comparison is 280.